Wx 354 HW 9
Solutions
1. N1 a,b
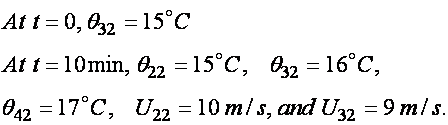
a. Numerically
forecast  assuming
  .
.
Note: from problem,
it is
clear that  =
600 s.
=
600 s.
Use Eq.
14.4:

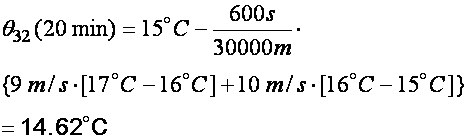
b. Yes, there is
evidence
that the solutions are diverging. At t =
0,  .
At t = 10 min,
.
At t = 10 min,  so
it appears to be increasing. At t = 20 min,
however,
so
it appears to be increasing. At t = 20 min,
however,  ,
a decrease from t
= 0. So one sequence is increasing and
the alternate one decreasing, therefore the solutions at these time
steps are
diverging.
,
a decrease from t
= 0. So one sequence is increasing and
the alternate one decreasing, therefore the solutions at these time
steps are
diverging.
2.
The model time step is 30 min = 1800 s. The
CFL condition gives the maximum time step
for a given wind velocity and grid spacing. It
defines the time it would take for a
variable to be advected across one entire
grid cell.
If the model time step exceeds the CFL limit, then variables could be advected to the current grid point from beyond
the adjacent grid cells, a situation not
accounted for in how
we formulated our finite difference representations in the model. If this is the case, the solution is
numerically unstable and can blow up fast.
To determine the
numerical
stability, compare the model time step with the CFL limit.
From 14.6,  ,
the maximum time steps for the given wind speeds are
,
the maximum time steps for the given wind speeds are
a. U = 1 m/s  >
1800 s ==>stable
>
1800 s ==>stable
b. U = 2 m/s  >
1800 s ==>stable
>
1800 s ==>stable
c. U = 5 m/s  >
1800 s ==>stable
>
1800 s ==>stable
d. U = 10 m/s  >
1800 s ==>stable
>
1800 s ==>stable
e. U = 15 m/s  >
1800 s ==>stable
>
1800 s ==>stable
f. U = 20 m/s  >
1800 s ==>stable
>
1800 s ==>stable
g. U = 50 m/s  >
1800 s ==>stable
>
1800 s ==>stable
h. U = 100 m/s  < 1800 s ==>unstable
As the winds speeds
increase,
the maximum allowable time-step decreases to prevent air parcels from advecting from beyond a neighboring grid-cell during that time step.
3. N3 Use eq.
14.7 but substituting pressure for height:
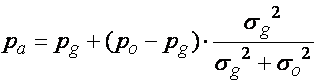

a. surface weather station: 

b. ship observation: 

c. Southern
Hemisphere manual
analysis: 

Discussion:
Observations with
smaller errors, that is, those which are more accurate such as a
conventional surface
weather station, get more weight in the analysis than the first guess
field;
observations with greater expected error, like the Southern hemisphere
manual
analysis get less weight than the first guess field in the analysis.
4. N4
|
Estimated Forecast Limit in
Days (From Fig. 4.7) |
|
|
Phenomenon |
Limit (days) |
|
a. tornadoes |
minutes |
|
b. hurricanes |
1-2 |
|
c. fronts |
0.5-1.5 |
|
d. cyclones |
3-5 |
|
e. Rossby waves |
6-10 |
|
f. thunderstorms |
< 1 hr |
|
g. |
1-3 hrs |
|
h. lenticular
clouds |
minutes-hours |
5. N5 Use the
regression
equation from the solved example on p. 324: 
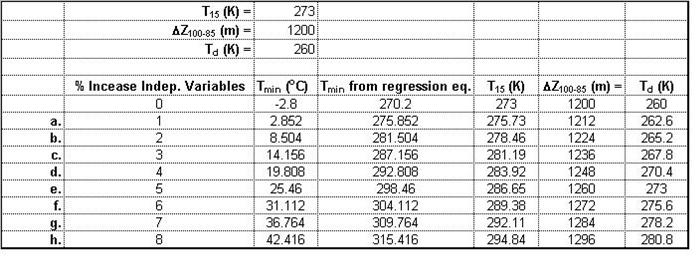
a. 
I used a
spreadsheet to make
the calculations: