Aliasing of data occurs when the sampling rate of an observed phenomenon is too low to adequately resolve variations in the phenomenon.
Example:
Suppose the true variation of a high frequency physical phenomenon is described by the blue curve in the figure below. And suppose we sample that phenomenon (i.e. make measurements of it) at a lower frequency indicated by the orange boxes. This frequency of sampling is not enough to resolve the true variations in the blue curve.

If we fit a new curve to our measurements we may think we are seeing variation at the frequency shown by the pink curve. This is an artifact our inadequate sampling rate.

Another classic aliasing example can be seen in western movies where the wagon wheels appear to be rotating backwards. This is because the sampling rate, i.e., the number of picture frames per second is not enough to resolve the forward movement of the spokes--they look like they're turning backwards.
The sampling rate for a NEXRAD is the pulse repetition frequency (PRF) (see Doppler formulas ). When the sampling rate is not great enough to resolve a certain frequency shift, this limits the velocities that can be resolved. This limit is called the maximum unambiguous velocity. Velocities that are greater than the maximum unambiguous velocity are said to be aliased, because they cannot be distinguished from lower velocities of opposite sign.
By convention, incoming motions are defined negative, and outgoing motions are positive.
The doppler radar measures the shift in frequency due to incoming or outgoing radial motion of a target.
This frequency shift can be translated into a phase shift, that is, a shift in position of a reference point on a wave with respect to an arbitrary location on the graph, such as the zero point.
The phase is the relative postion of the wave form with respect to some starting point. Waves that are in phase have the same y-value at the x=0 point and other points along the wave.
The following spread sheet depicts how phase shifts occur. For example, a phase shift of 30 degrees and -30 degrees yields the following curves:

At phase shifts of + or - 170 degrees we see that the phase-shifted curves are near each other:
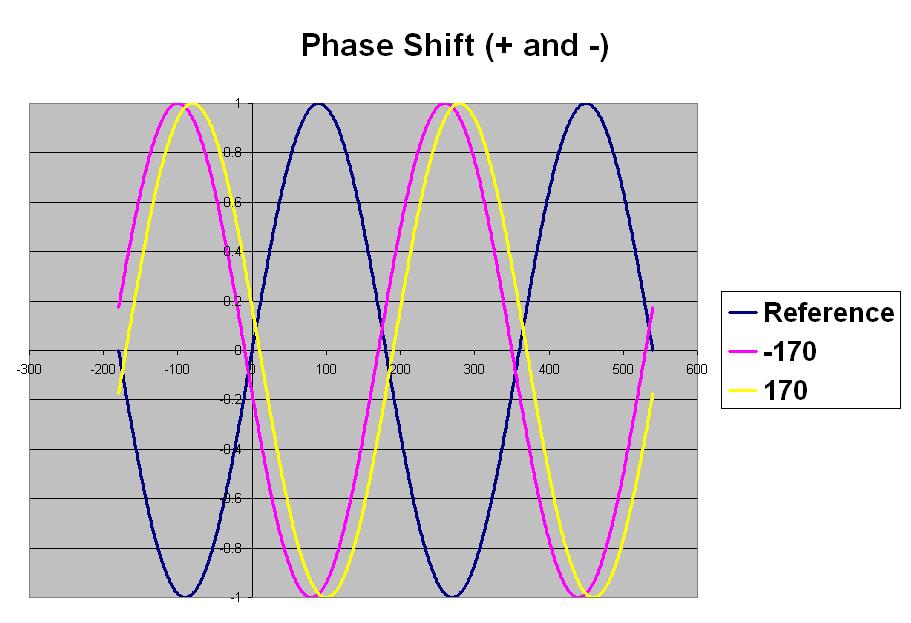
At + or - 180 degrees the two curves are on top of each other:

Velocity aliasing occurs when the phase shift is 180 degrees or more, which occurs at or above the maximum unambiguous velocity. At these velocities, the phase shift is such that the radar cannot distinguish between the velocity above maximum unambiguous velocity that has a phase shift of above 180 degrees, and that of a lower phase shift of opposite sign. For example, an aliased velocity with a phase shift of 210 degrees (180 + 30 degrees) is not distinguishable from an unaliased velocity with a phase shift of -150 degrees (-180 + 30 degrees):

