Two uses for the term "comma cloud" in relation to satellite image patterns.
(1) traditional meaning refers to cloud pattern associated with mature midlatitude cyclonic storm systems.
(2) west coast meaning refers to a non-frontal single air-mass area of enhanced clouds associated with an upper level cyclonic vorticity maximum.
Both literally shaped like a comma.
Comma Cloud Associated With Midlatitude Cyclone
Comma-shaped with a head, tail, and socalled dry-slot region to west of tail.
Associated with synoptic scale weather features of a midlatitude cyclone.
16 March 1998
Comma cloud pattern is essentially created by so-called "conveyor belt" circulations of midlatitude storm systems:
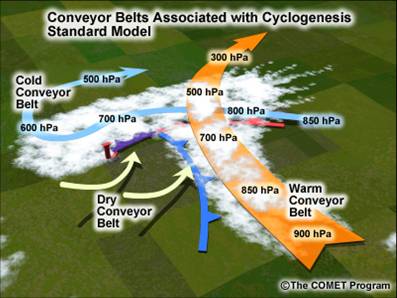
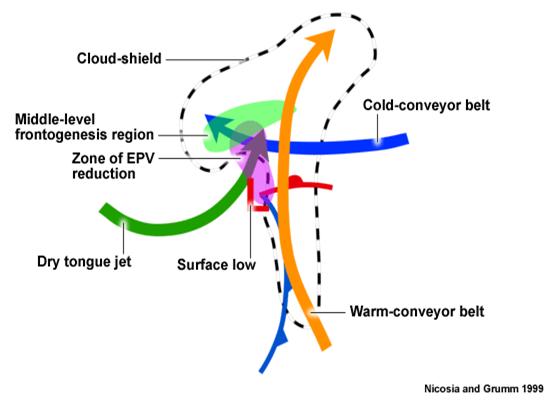
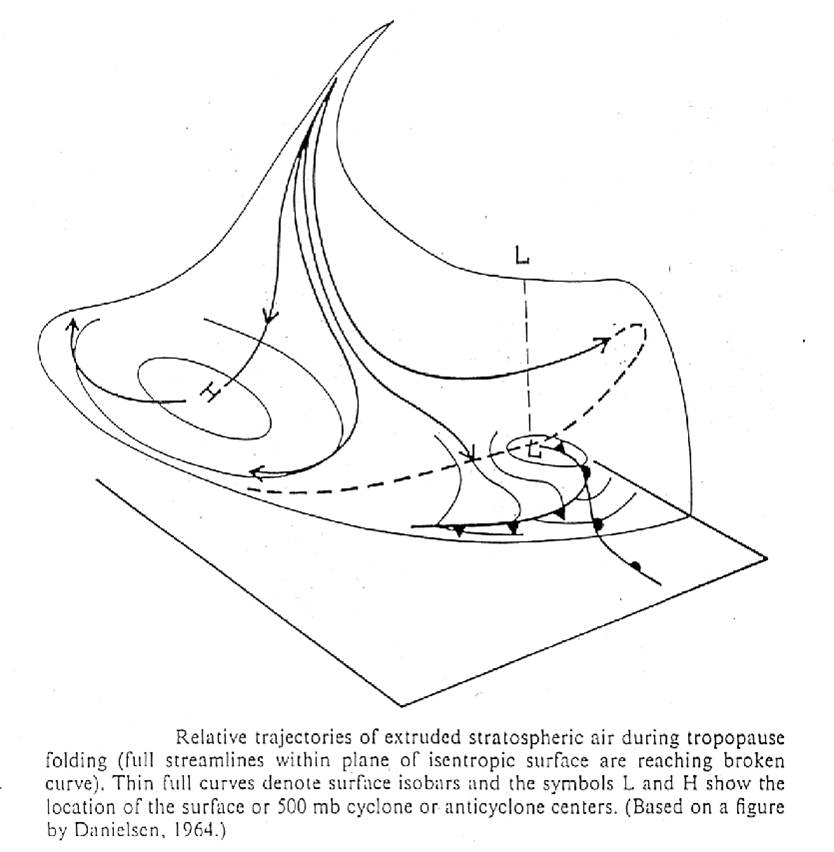
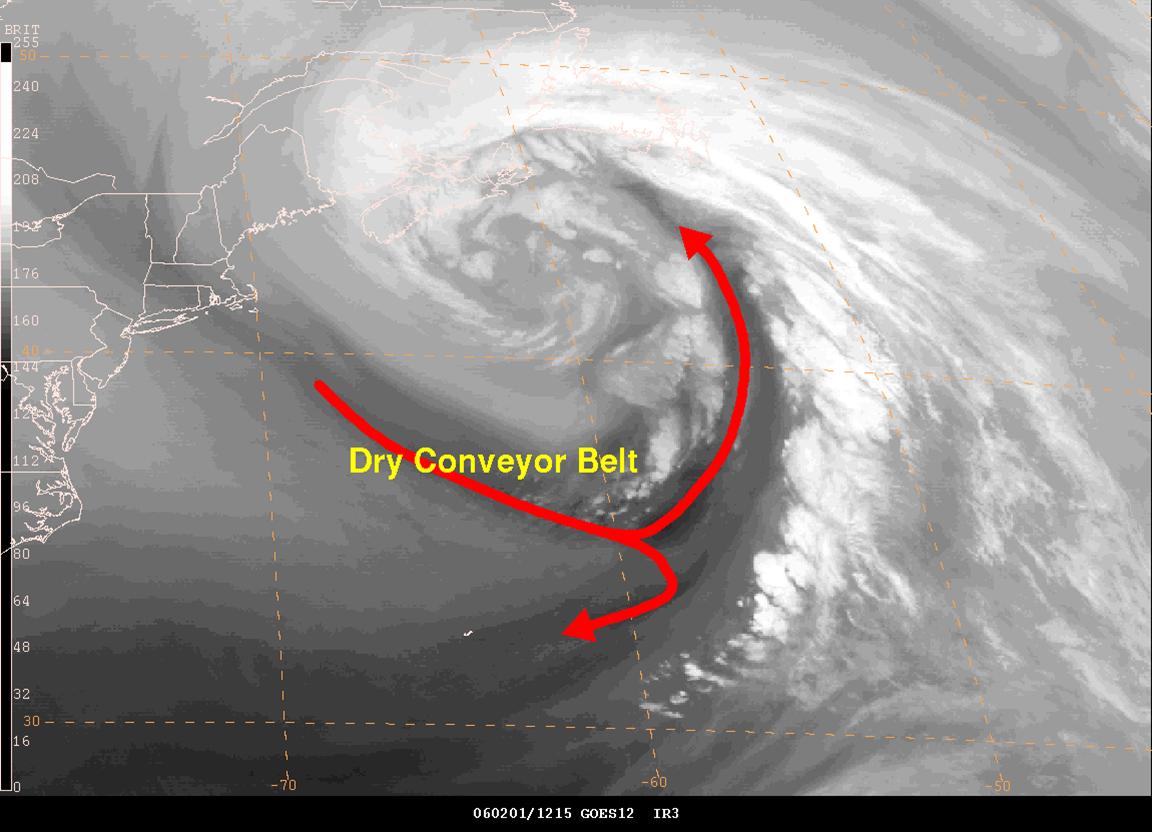
Dry slot region forms from "dry conveyor belt." Dry upper tropospheric and lower stratospheric air descends behind cold front:
Example of Comma Cloud Associated with a Midlatitude Cyclone:
01 Feb. 2006 Unenhanced IR of comma cloud pattern associated with occluding low pressure center.
01 Feb. 2006 Enhanced IR of comma cloud pattern associated with occluding low pressure center.
Dry slot region shows up in satellite water vapor imagery:
Comma Cloud Associated With Non-frontal Single Air Mass Enhanced Clouds (West Coast Usage):
West Coast meteorologists use the term comma cloud to refer to non-frontal areas of enhanced cloudiness associated with an upper-level vorticity maximum, often well behind the front in the cold air mass. They are much smaller than the classical frontal comma cloud formation.
Click on this loop of non-frontal comma cloud behind a more classical comma cloud feature approaching the west coast of the U.S.
This "comma" forms as a propagating upper-level vorticity maximum moves over an area of open cell convection. The lifting environment in the positive vorticity advection area ahead of the vort-max allows for deeper convection and higher, colder cloud tops.
Monteverdi (1976) asserts that these single air-mass disturbances were associated with an average of 30% of the annual precipitation at San Francisco.
Reference
Monteverdi, John P.
The Single Air Mass Disturbance and Precipitation Characteristics at San Francisco
Monthly Weather Review 1976 104: 1289-1296