Northern California Fires on Satellite, 2017
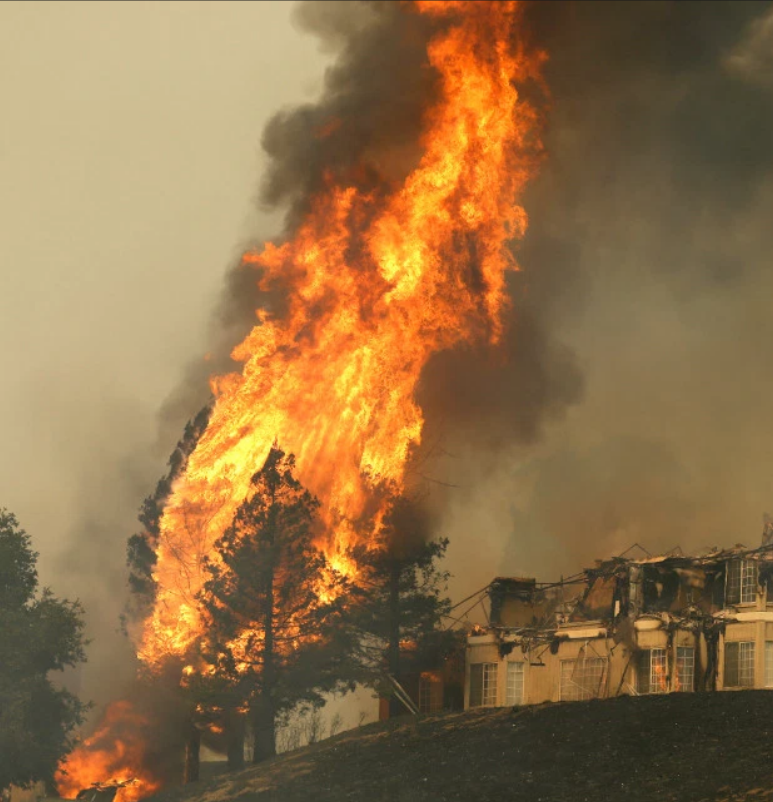
This page shows satellite views of the
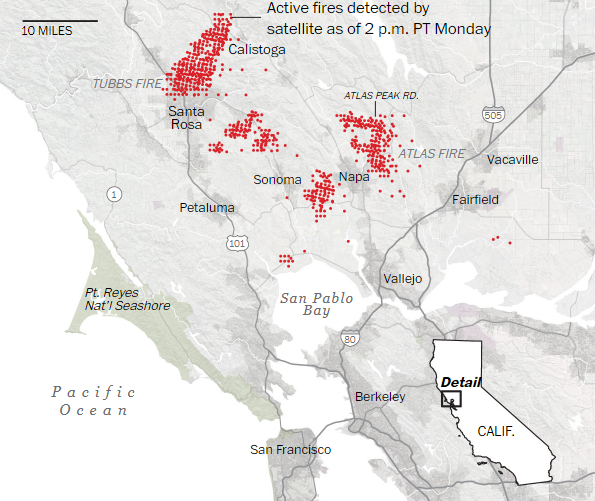
explosive growth (see animations below) of fires in Sonoma and
Napa Counties in California due to an extreme case of "Diablo"
winds when high pressure builds into the Great Basin, creating
hot, dry, downslope/offshore air flow. These were the most
deadly and destructive wildfires in California history.


Satellite
Animation of Explosive Formation of Sonoma/Napa Fire Hotspots in
NearIR
Black and dark grey pixels are GOES Channel 2 (Near
IR 3.9 micrometer) fire hotspots. Pixels are approximately
4+ km across. They first appear in Sonoma and Napa Counties around
4:45 UTC (9:45 pm PDT, Sunday, Oct. 8, 2017) then grow rapidly,
expanding toward the southwest from the hot, dry, northeasterly
"Diablo" winds (the Northern California analog of Santa Ana
winds). The animation ends on Monday, Oct. 9, at 15:00 UTC
(8:00 am PDT).
VIS
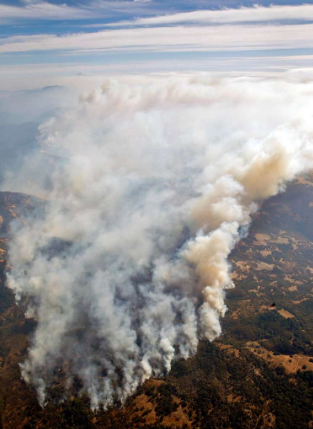
Satellite Animation of Smoke Blowing Offshore
Easterly "Diablo" winds blowing
smoke offshore from fires in Sonoma and Napa Counties during
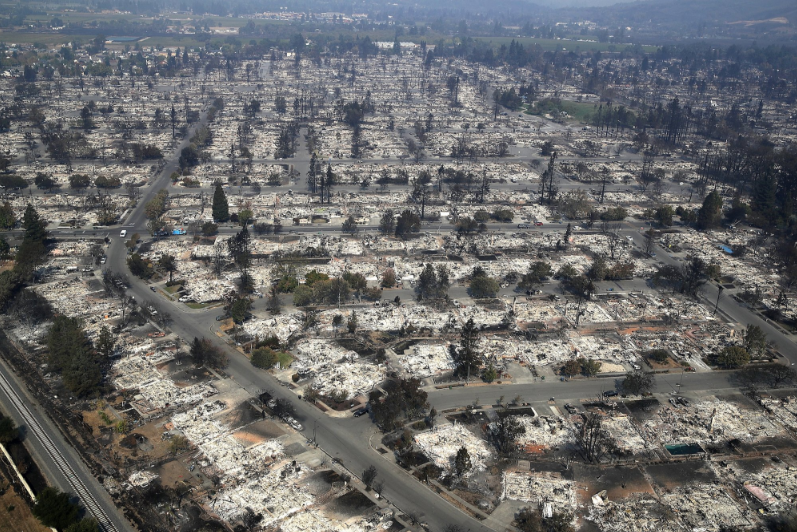
the day on Monday, Oct. 9, 2017. As of this writing (1
week later), 41
people are known to have died in these fires and at
least 5700
buildings destroyed.
New GOES-16 Satellite Imagery
The GOES-16 satellite has new channels with
different wavelengths that allow for color satellite
imagery, along with new algorithms and channels that detect
fire hotspots. The following are links from CIRA
(Cooperative Institute for Research in the Atmosphere at
Colorado State University) to GOES-16 animations showing
smoke plumes and fire hotspots in never-before-available
full color geostationary satellite imagery:
Full
color GOES-16 imagery of hotspots and smoke
plumes from California wildfires.
Full
color GOES-16 imagery of smoke from California fires
blowing offshore with northeasterly Diablo winds.