1.
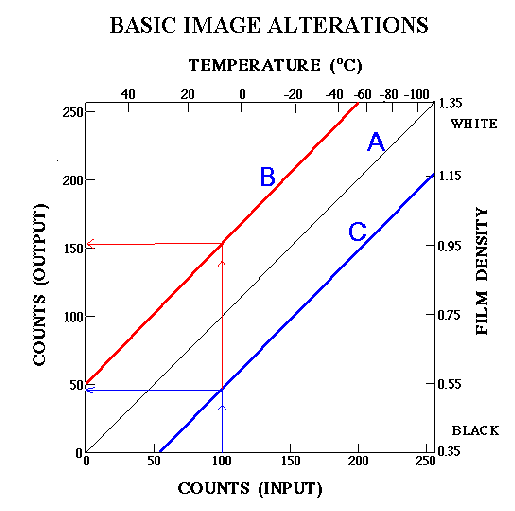
(a) How does the changing the enhancement curve from "unenhanced" (curve A) to curve B change a satellite image? Give a specific example of how the same temperature is represented differently on the image by the different curves.
Moving the "unenhanced" curve upward to "B" makes the entire image brighter, because every temperature is represented as a lighter shade of grey. As an example, a temperature of 0 deg C is approximately 120 brightness counts (output) from the unenhanced image, but about 170 counts on curve "B."
(b) How does changing the enhancement curve from "unenhanced" (curve A) to curve C change a satellite image? Give a specific example of how the same temperature is represented differently on the image by the different curves.
Moving to curve "C" darkens the entire image, because every temperature is represented as a darker shade of grey. For example, a temperature of 0 deg C is approximately 120 brightness counts (output) from the unenhanced image, but about 70 counts on curve "C".
2.
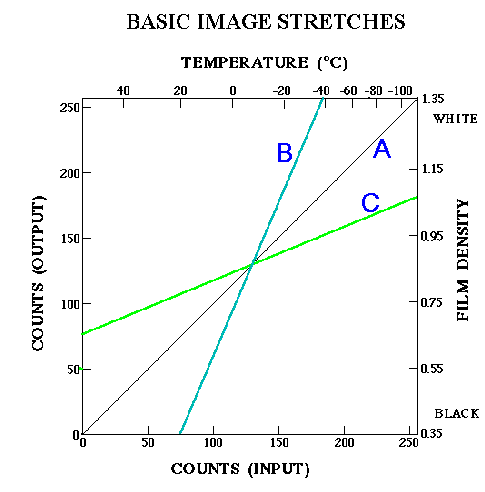
(a) How does the changing the enhancement curve from
"unenhanced" (curve A) to curve B change a satellite image? How
is
a temperature of -40 deg C represented differently (in terms of grey
shades)
on the image by the different curves? How is a temperature of about 20
deg C represented differently (in terms of grey shades) on the image by
the different curves?
Changing from "unenhanced" to curve "B" increases the overall
contrast of the image because a narrower range of temperatures is
stretched
out over a larger range of grey shades. For example a temperature
of -40 deg C was originally a light grey shade ( ~180 brightness
counts)
on the unenhanced image; on curve B it becomes white (255 brightness
counts).
A temperature of 20 deg C was a dark grey shade ( ~ 70 counts) on the
unenhanced
curve; on curve B it becomes black ( 0 counts). Also,curve B
represents
all temperatures colder than -40 deg C by the same pure white shade,
and
all temperatures warmer than 20 deg C by the same pure black shade.
(b) How does changing the enhancement curve from "unenhanced" (curve A) to curve C change a satellite image? How is a temperature of -110 deg C represented differently (in terms of grey shades) on the image by the different curves? How is a temperature of about 55 deg C represented differently (in terms of grey shades) on the image by the different curves?
Changing from "unenhanced" to curve "C" decreases the overall contrast of the image because the entire range of temperatures is "compressed" into a smaller range of grey shades. For example a temperature of -40 deg C was originally a light grey shade ( ~180 brightness counts) on the unenhanced image; on curve C it becomes darker (150 brightness counts). A temperature of 20 deg C was a dark grey shade ( ~ 70 counts) on the unenhanced curve; on curve B it becomes lighter (110 counts). On curve "C" the entire range of temperatures (-110 deg C to 55 deg C) is represented by fewer grey shades (brightness counts from about 170 to about 80); on the unenhanced curve it is represented by all grey shades (brightness counts from 255 to 0).
3.
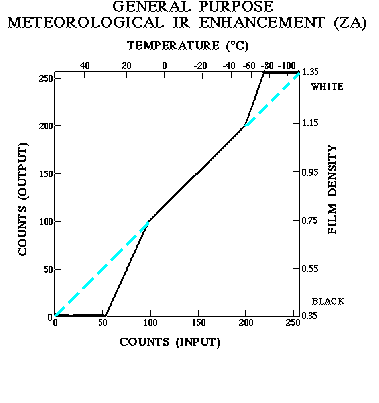
In the above figure, the ZA enhancement curve is shown
by the solid black line. The unenhanced curve is shown by dashed lines
where it deviates from the ZA curve. Explain how the different segments
of the ZA curve would change an unenhanced satellite image in terms of
how the following temperature ranges are represented by grey shades.
56.7 deg C to 29.4 deg C
This entire temperature range becomes compressed into one black
shade. The earth's atmosphere does not generally experience
temperatures
much warmer than 33 deg C.
29.2 deg C to 6.8 deg C
The ZA curve increases contrast in this temperature range because
now 33 to 10 deg C is represented by zero to 100 brightness counts
whereas
the unenhanced curve represents this same temperature range with 50 to
100 brightness counts. Physically it makes it easier to distinguish
surface
features and low clouds.
6.7 deg C to -55.7 deg C
No change--same as unenhanced curve.
-56.0 deg C to -75.2 deg C
The ZA curve increases contrast in this temperature range because
now -50 to -72 deg C is represented by 200 to 255 brightness counts
whereas
the unenhanced curve represents this same temperature range with 200 to
220 brightness counts. Physically it makes it easier to
distinguish
features of very cold clouds.
-75.7 deg C to -110.3 deg C
This entire temperature range becomes compressed into one white
shade. The troposphere does not generally experience temperatures much
colder than -80 deg C.