The Radar Summary chart is a government-produced, somewhat outmoded way of looking at radar information. This chart is produced hourly and comes from the Radar Weather Reports text product.
**Here is what the government publication, Aviation Weather Services has to say about the Radar Weather Reports product: "This is a textual product derived from the WSR-88D NEXRAD radar without human intervention. The resolution of this textual product is very coarse, up to 80 minutes old, and should only be used if no other radar information is unavailable."** By extension, I would say that the radar summary chart should only be used in the absence of other, better radar information.
Nevertheless it seems to still be in use by pilots, and has some aviation-specific annotations which are very useful.
Example:
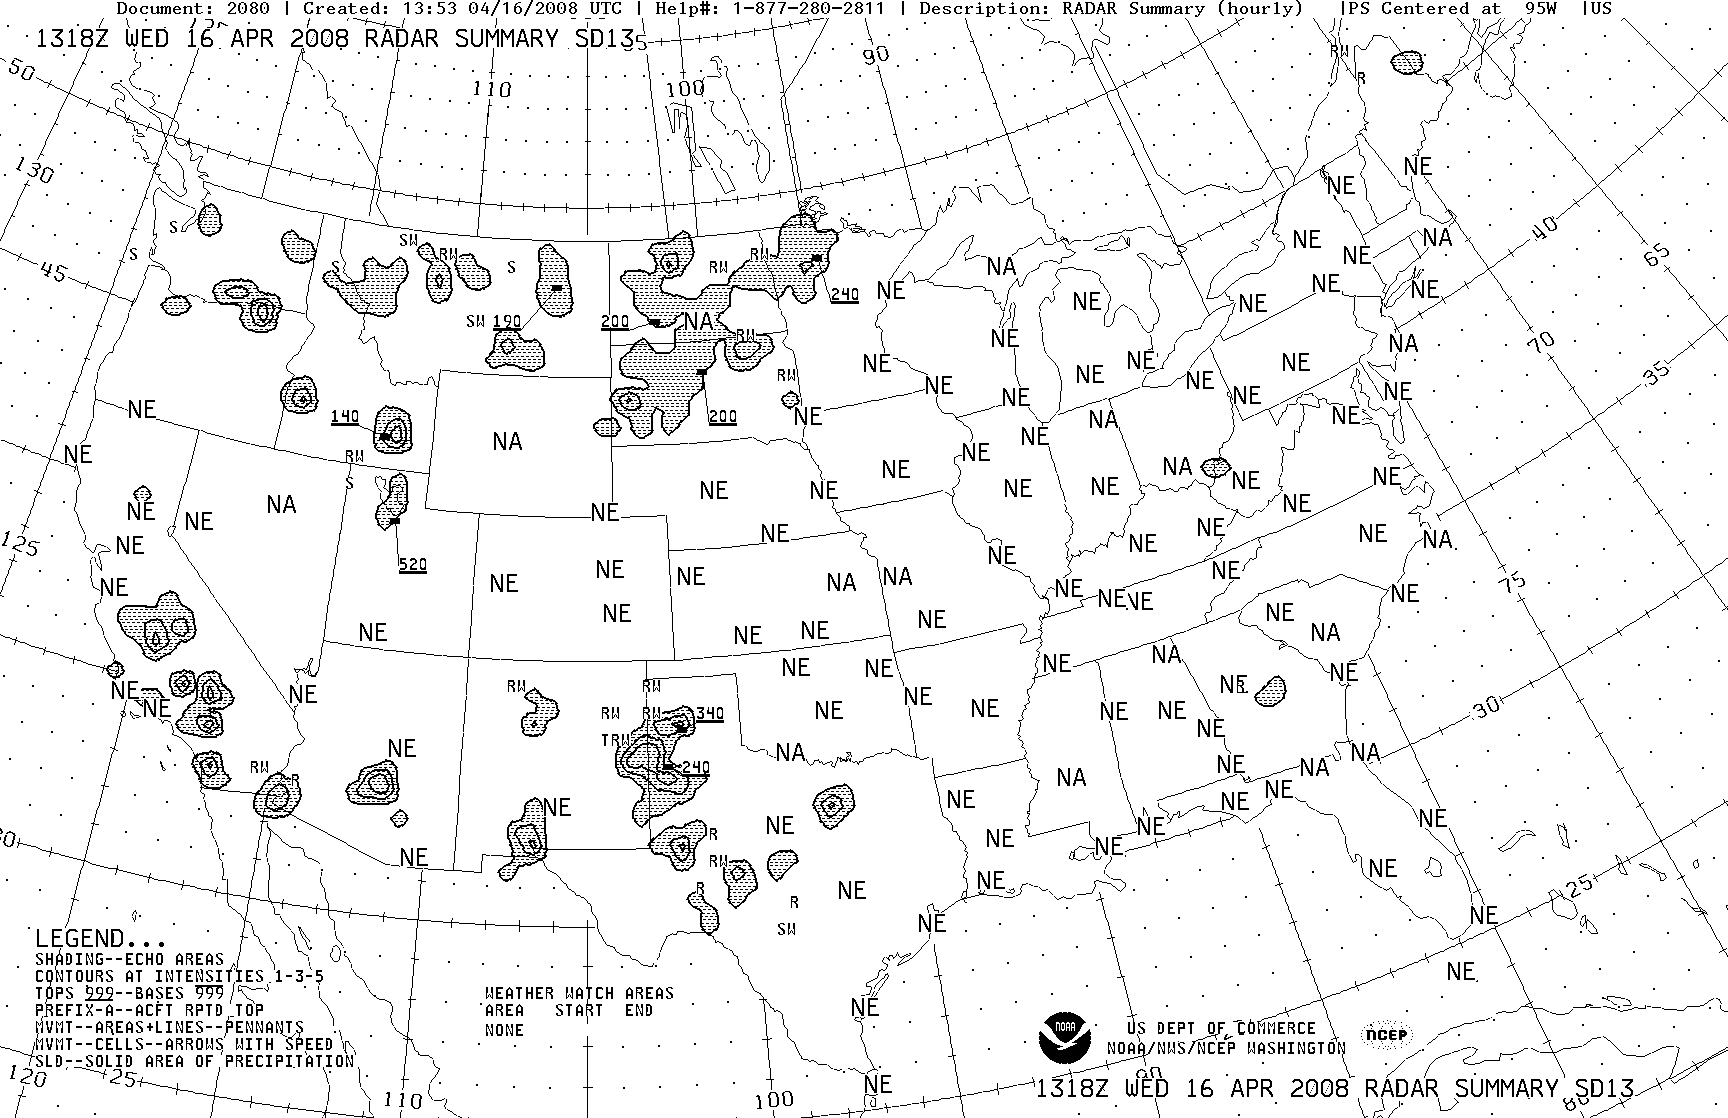
The chart is disseminated once per hour. It contains the locations of radar echoes showing precipitation, with information about its type, intensity, configuration, coverage, echo top, and cell movement. Details can be found in the FAA Circular AC 00-45F Part 2 of Aviation Weather Services.
An updated version of the radar summary chart can be found on the ADDS page under Radar==>United States Radar.
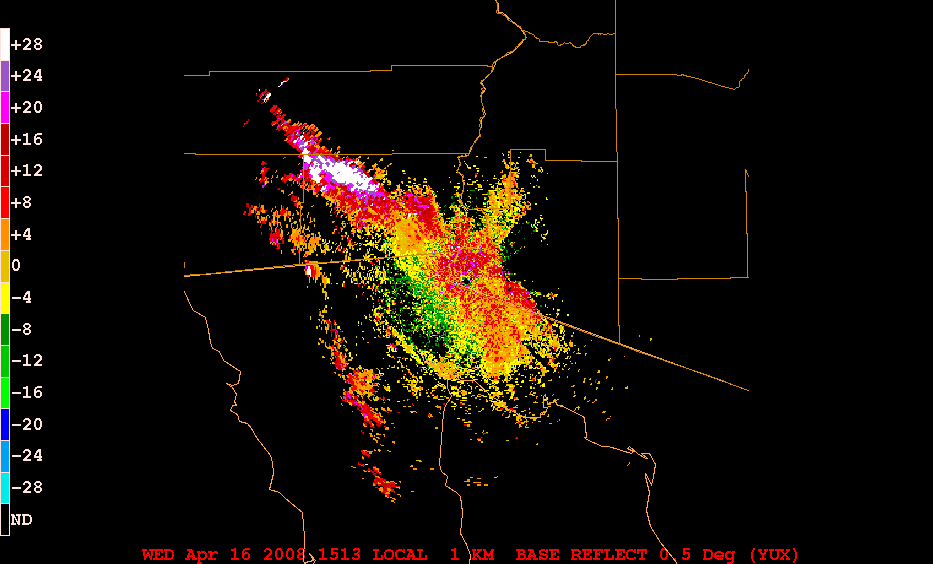
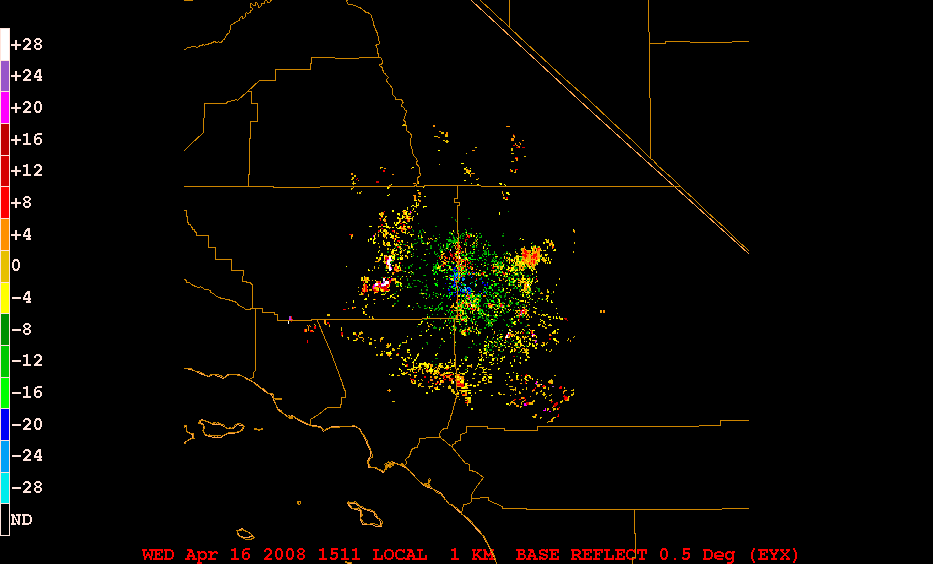
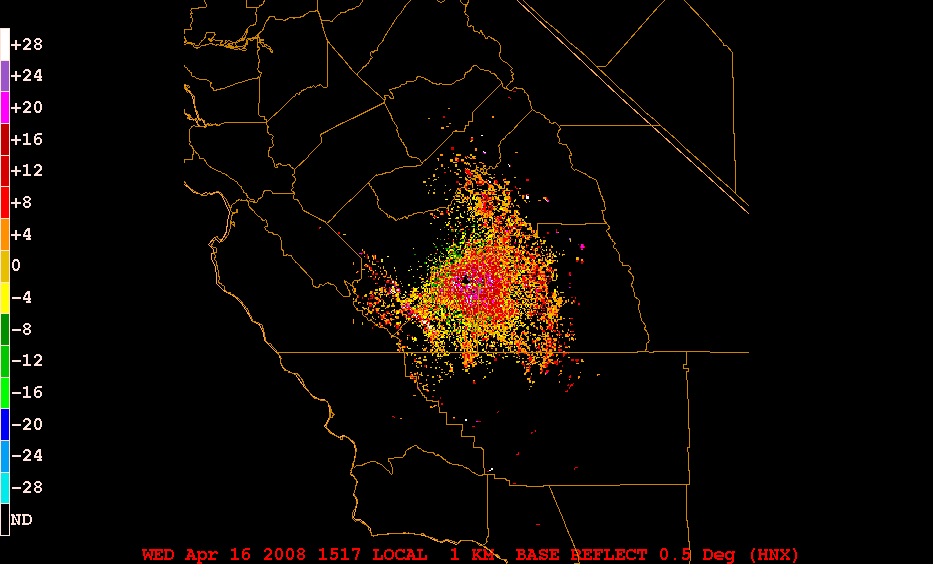
Because the Radar Summary Chart is computer-generated from the Radar Weather Reports which are themselves derived from the radar data without human intervention there can be serious deficiences with the data. The case below documents an example of ground clutter and anomalous propagation being reported as a thunderstorm!
Note TRW with echo tops at 39,000 feet being reported over the California/Arizona/Mexican border, with strong echoes being reported over much of southern California:
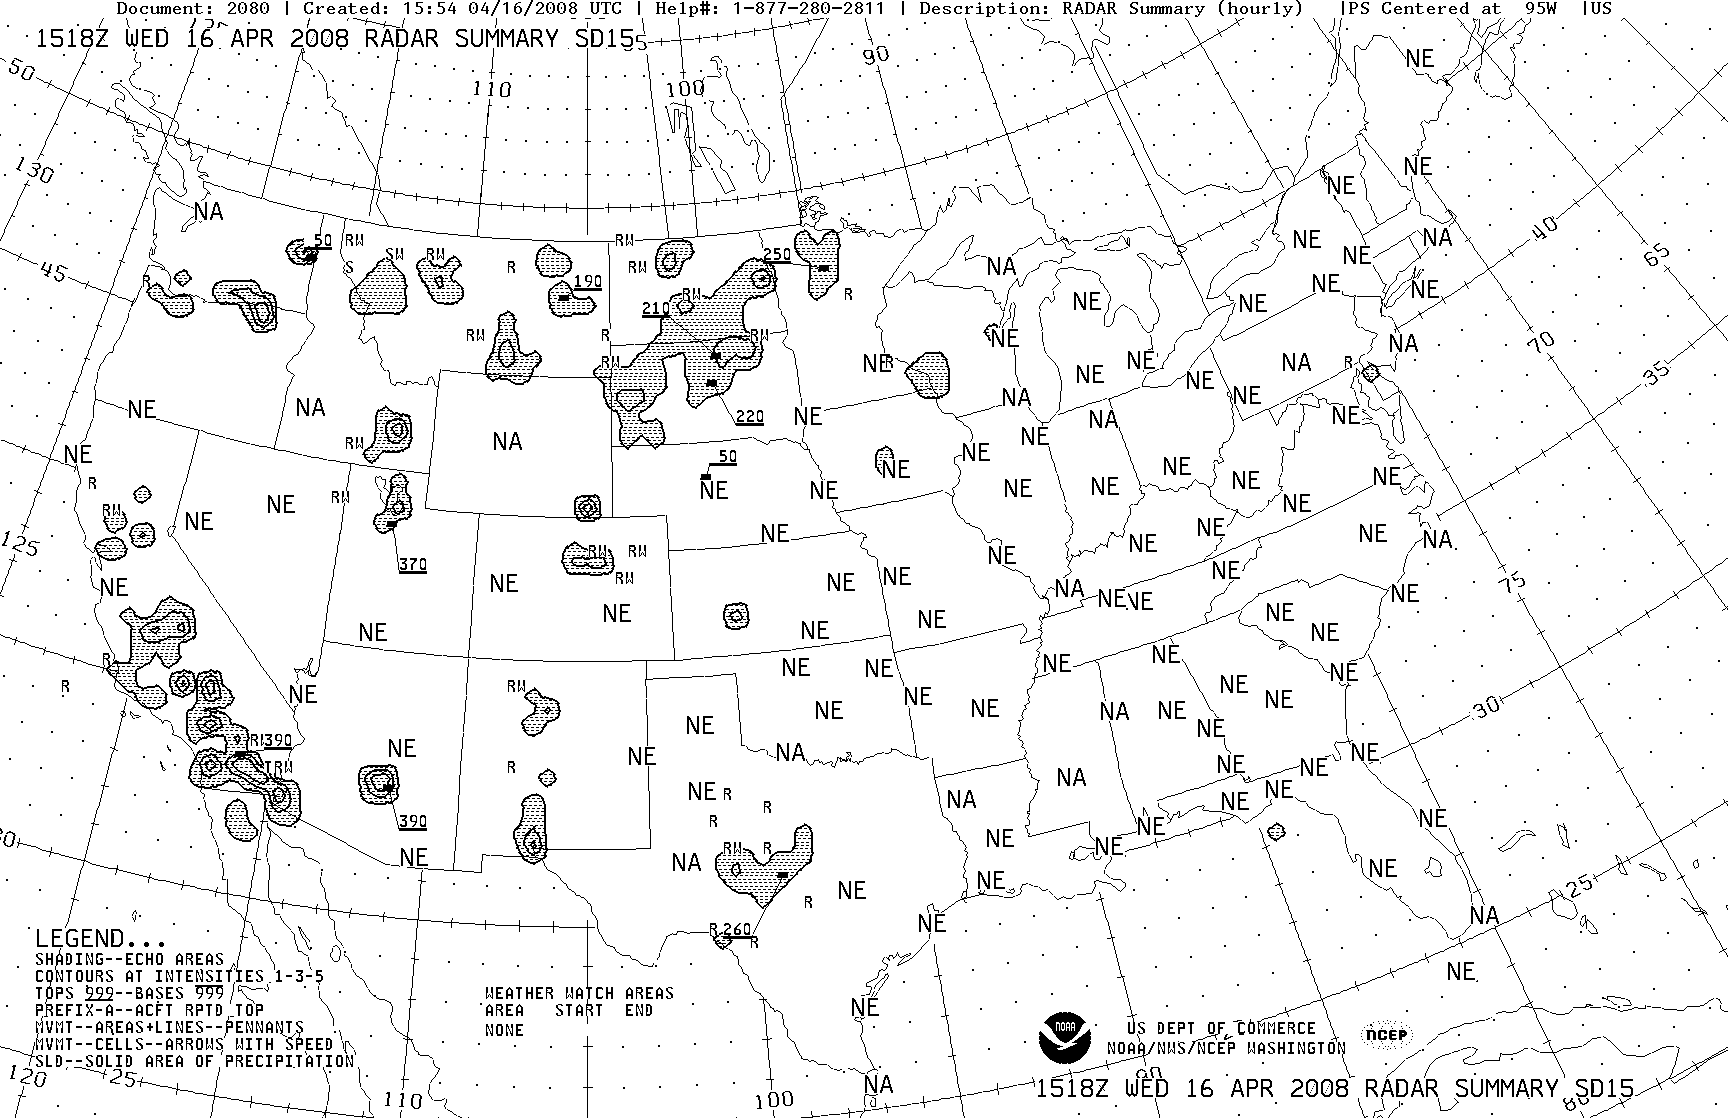
Radars from this region depict ground clutter and anomalous propagation:
Phoenix radar (YUX):
Edwards Air Force Base (EYX):
Hanford radar (HNX):
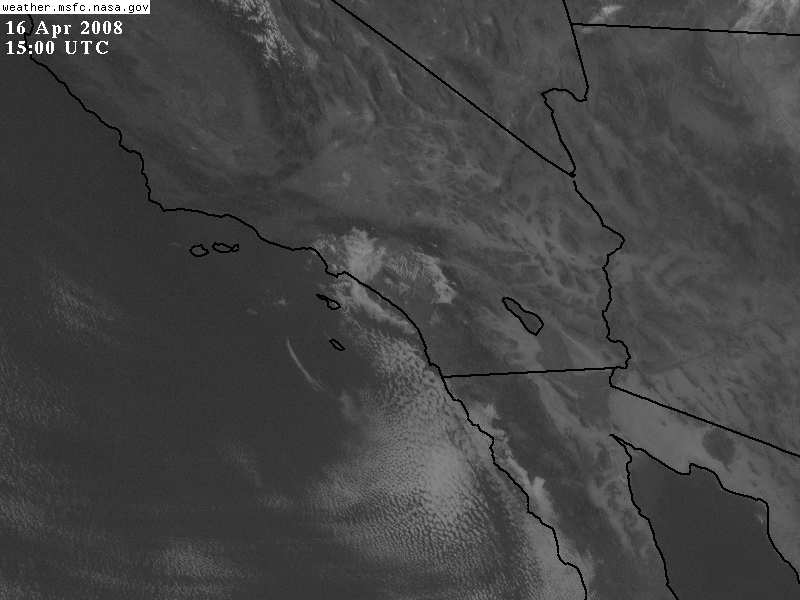
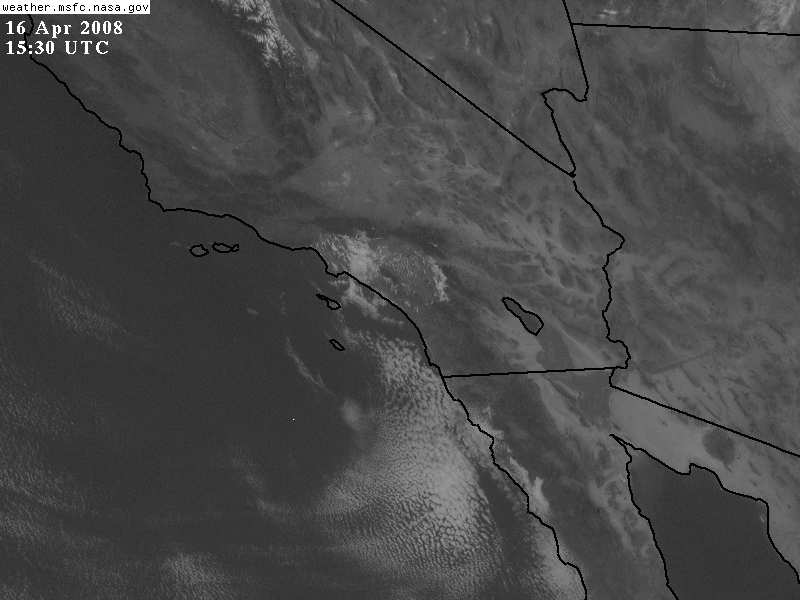
Satellite images of the region from 1500z and 1530z show mostly clear conditions with only a few marine stratocumulus over the L.A. Basin: