Dr. Brad Muller
The radar "bright band" is a phenomenon that shows up as higher reflectivity near the elevation of the melting layer between snow and rain.
As mentioned in conjunction with the radar equation, the dielectric constant for ice is 0.197 while it is 0.93 for liquid water. This means that liquid water is considerably more reflective than ice for microwave radiation. We also know that the reflectivity factor is proportional to the 6th power of the particle size. Since snowflakes are usually larger than raindrops, their size compensates somewhat for the lack of ice reflectivity, and they still show up pretty well on radar (although as previously mentioned, sometimes clear-air mode is used in snowstorms so as to be able to better view details of the reflectivity).
The bright band occurs in the layer where snowflakes are melting into rain (following image borrowed from https://apollo.lsc.vsc.edu/classes/remote/lecture_notes/radar/conventional/bright_band.html:
Two effects are occurring. The first is that when the snowflakes first start to melt, they melt from the outside in, so at first they have nearly the diameter of a snowflake (large) but are coated with liquid (high index of refraction), both combining for a high reflectivity. The second effect is that as the snowflakes melt and shrink into liquid water drops, their terminal velocity increases, and they start to fall faster, leaving fewer of them in the radar-sampled volume just below the melting layer. Hence the bright band becomes a vertical maximum in the reflectivity.
The bright band is best seen on RHI displays (second panel):
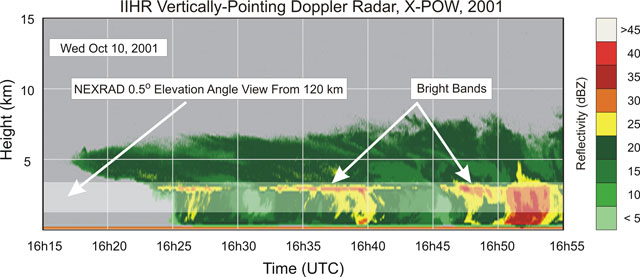
It also can be seen in height-time plots of radar data from vertically pointing radars:
On a PPI display, the bright band will be seen at the range where the radar beam cuts through the vertical level of the melting layer. Since the radar is scanning at an angle upward, the brightband in a PPI appears as a bright ring around the radar location, fairly close in to the radar on the higher tilts.
Bright band at N3R from Goodland, Kansas.
Bright band at N3R from Portland, Oregon.
Bright band at N3R from Portland, Maine. Click here for an animation.
To look for the bright band in real time, choose an area with widespread stratiform precipitation falling at the ground as rain (check NOAA's NEXRAD page in comparison with NCAR's Surface Data page.) Use Unidata's IDV (Integrated Data Viewer) to access the radar data as described below:
Using the IDV to View the Radar Bright Band
NOAAPort does not disseminate radar reflectivity from "tilts" other than the lowest one any more, so higher tilts are best seen in the IDV (Integrated Data Viewer). The IDV was originally a UNIX program, but recently versions for Windows have become available. You can get to the IDV for windows via the S: Drive => Courses => Outgoing => WX => wx-IDV => Start Menu Items - Win 7 Integrated Data Viewer 3.0u2 and double click on "Integrated Data Viewer."
The full address is S:\COURSES\OUTGOING\WX\wx-IDV\Start Menu Items - Win7 - Integrated Data Viewer 3.0u2
Use the "Data" dropdown window to choose "NEXRAD Radar Files" then on click on the "NEXRAD - Remote" tab on the Dashboard to pull up a map of NEXRAD locations. Zoom in with a rubber band box (left click, hold, and move the cursor around), or unclick "Declutter" then zoom, to see stations that may not show up at first. Click on the desired station, then select some times to display (either relative or absolute), then click "Add Source." Then select "Reflectivity" from fields, and "Radar Sweep View in 3D" from Displays, then click on "Create Display." The IDV defaults to the 0.5 degree elevation angle, but on the Dashboard you can select any elevation angle. The best for views for seeing the bright band are usually between about 2.4 and 6 degrees, but you'll have to experiment.
To take full advantage of the 3-D capabilities, right click on the radar image, and hold down while moving the cursor--prepare to be amazed! To reset to the original plan view, look for the depiction of a 3-D rectangle with its top face highlighted in blue at the upper left of the display window, and click that icon.
Notes:
The IDV is available for download to your own personal computer from the Unidata web page under the "Downloads" dropdown!
The IDV allows you to view products other than reflectivity such as Radial Velocity and the new Dual Polarization products using the Field Selector on the Dashboard. It is best to clear out your previous data set before selecting a new data set or station to display by clicking the scissors icon or going to "Edit" then "Remove all Displays and Data."