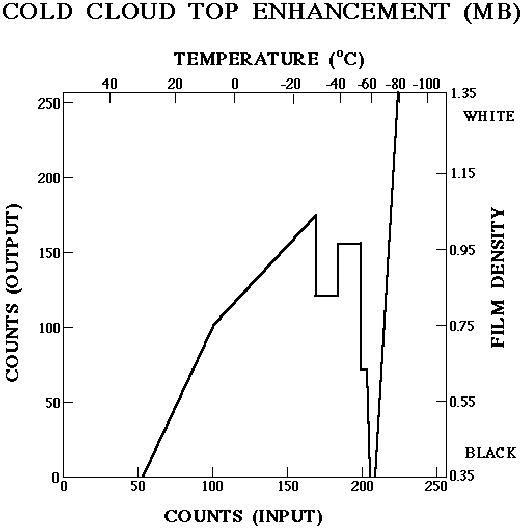
MB enhancement curve for infrared imagery
MB enhancement curve for infrared imagery
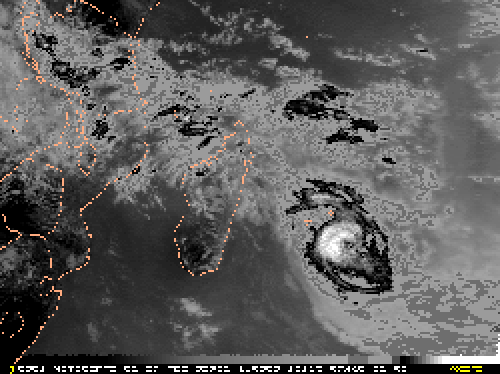
Infrared image with MB ehnacement
Compare the structure of the tropical cyclone cloud tops with the MB enhancement to that with no enhancement.
The MB enhancement curve for thermal IR imagery artificially defines brightness values for temperatures of less than -35 º C. This curve is the most widely used in the meteorological community because of the way cold cloud tops are highlighted. For temperatures above -35 º C the MB enhancement is similar to the ZA enhancement. However, for the temperature range of -35 to -60 º C, there is a general decerease in assigned output brightness values with decreasing temperature. Note that for temperatures below about -60 º C, the curve is severely stretched across all brightness values. Details of storm top structure for cloud tops that reach these very cold temperature levels can be easily emphasized with the MB curve.