Severe weather can be recognized in doppler radar using either velocity characteristics or reflectivity echo morphology. In this section we will focus on reflectivity signatures.
Hail: In the following images, golfball-sized hail was associated with the pink areas. Very high reflectivities usually are associated with hail.
VIS satellite loop of Daytona hailstorm.
Powerpoint Presentation on Daytona Hailstorm given for ERAU Applied Meteorology program10th anniversary.
An animation of a Cocoa Beach hailstorm in the high resolution reflectivity product:
Cocoa hailstorm, 3-27-2019.
A different Daytona hailstorm in the high resolution reflectivity product:
Daytona hailstorm, 3-20-2018.
Daytona hailstorm, zoomed, 3-20-2018.
Another case of large hail in Deland is seen in this loop of reflectivity:
Deland hailstorm, April 4, 2008.
A third example from Memphis, Tennessee, Feb. 5-6 2008 includes a three-body-scatter spike:
This figure shows that high values of reflectivity indicative of large hail also show high VIL (Vertically Integrated Liquid) values; thus VIL is valuable in severe weather detection.
Memphis, TN Reflectivity, Feb. 5-6, 2008.
Memphis, TN VIL, Feb. 5-6, 2008.
LEWP: Line Echo Wave Pattern--a bend within a relatively linear echo feature that points back (usually to the west). It may be indicative of developing rotational winds in a thunderstorm; rotating thunderstorms also are known as supercells, and are associated with a mesocyclone which is the parent storm of a tornado.
LEWP over Arkansas (Figure from NWS COMET program)
Bow Echo: The bow echo is a forward bulge (usually to the east) in a relatively linear echo feature. It is a sign of very strong low-level straight-line winds, and may indicate the presence of a downburst or microburst. Because of the wind shear associated with the very strong straight-line winds, rotation can develop at the northern and southern tip of bow echoes, producing formations called "bookend vortices;" therefore these locations are sometimes associated with tornadoes. However, the bow echo is primarily a straight-line wind signature. The area of weak echoes to the rear of the bow is called the "rear inflow notch." This is where the strongest winds are expected.
Bow echoes typically follow the evolution depicted in the following two slides:
From Steve Davis, NWS Milwaukee
From NWS COMET Meted
Note: the online "literature" seems to contain some confusion between the bow echo and the LEWP. They may both be present on different parts of a linear echo as shown in the following figure and the animation below. Typically, however the "bent-back" LEWP is associated with mesocyclone rotational winds, while the bow echo is associated with straight-line winds.
Example 1: Bookend vortex animation of radar images from TBW associated with a bow echo and LEWP.
Example 2: Bow echo associated with a "Derecho," i.e., a long-lived convective wind event, in the La Crosse, Wisconsin, high resolution reflectivity (N0Q) product from July 20, 2017. This one produced many reports of severe thunderstorm winds greater than 50 kts in several states. This is the NEXRAD high resolution base velocity (N0U) product from La Crosse, Wisconsin, from July 20, 2017. An IR satellite view of the associated mesoscale convective system can be found here. The Storm Prediction Center has produced a comprehensive information page on Derechos. On the northern end of the below echoes is an LEWP and bookend vortex.
Example 3: Daytona Spring 2001 Bow Echo Windstorm
Hook Echo: A thin, curving , extension of a very high reflectivity feature indicative of mesocylonic rotation and potentially tornadoes. This was the "original" tornado signature back before doppler weather radar!
Example 1:
Hook echoes--May 3-4, 1999 supercells near Oklahoma City --NWS-Norman, Oklahoma
Example 2:
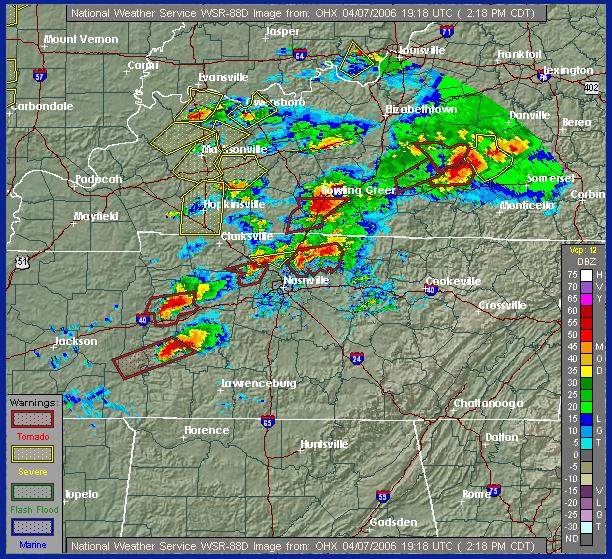
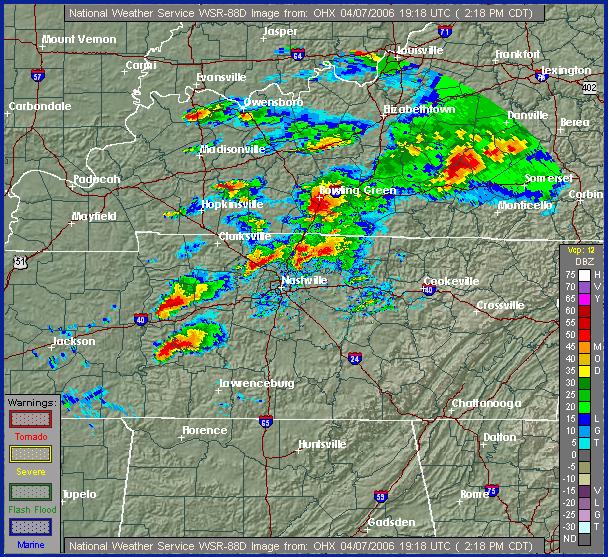
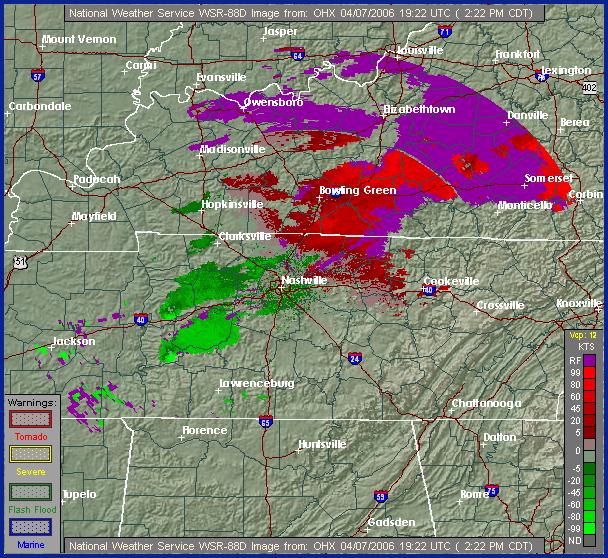
The following image from April 7, 2006 indicates a number of tornado warnings associated with hook echoes:
Associated doppler velocity couplets. The signature is much more easily seen on the storm-relative velocity than on the base velocity.
Storm Relative:
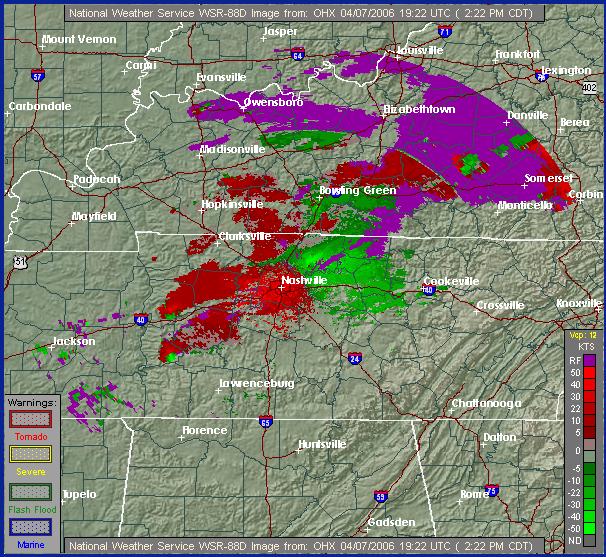
Base Velocity:
Example 3: Hook Echo Case from Norteastern Iowa Tornadoes, April 9, 2011
Link to NWS Des Moines Damage Surveys and Photos
Tornado reports:
| 0137 | 4 ENE KIRON | SAC | IA | 4222 | 9525 | STORM CHASER REPORTS TORNADO ON THE GROUND BY HIGHWAY39 AND FOX AVE. NORTH OF KIRON, IA. TORNADO IS IN RURAL AREA. (DMX) | |
| 0138 | W ODEBOLT | SAC | IA | 4231 | 9526 | LOT OF DEBRIS ... POWER OUTAGES (DMX) | |
| 0143 | 2 NE ODEBOLT | SAC | IA | 4233 | 9523 | (DMX) | |
| 0144 | 2 SW EARLY | SAC | IA | 4244 | 9518 | (DMX) | |
| 0157 | 6 N ODEBOLT | SAC | IA | 4240 | 9525 | PUBLIC REPORTED A MORTON BUILDING DESTROYED. (DMX) | |
| 0158 | 2 E SCHALLER | SAC | IA | 4250 | 9526 | LARGE WEDGE TORNADO JUST NORTH OF THE INTERSECTION OF HIGHWAYS 20 AND 71. (DMX) | |
| 0203 | 7 NW SAC CITY | SAC | IA | 4249 | 9509 | TRAINED SPOTTER REPORTS LARGE WEDGE TORNADO ON THE GROUND. (DMX) | |
| 0203 | 5 NW POMEROY | POCAHONTAS | IA | 4260 | 9475 | LARGE TORNADO ON THE GROUND. DAMAGE UNKNOWN. (DMX) | |
| 0209 | 4 N NEMAHA | BUENA VISTA | IA | 4257 | 9509 | LARGE WEDGE TORNADO (DMX) | |
| 0214 | 5 WSW NEWELL | BUENA VISTA | IA | 4258 | 9509 | RELAYED FROM SPOTTER NETWORK (FSD) | |
| 0246 | 7 W STORM LAKE | BUENA VISTA | IA | 4264 | 9534 | TWO TORNADOES REPORTED BY CHASERS 7W OF STORM LAKE RELAYED BY MEDIA (FSD) | |
| 0252 | 2 N FONDA | POCAHONTAS | IA | 4261 | 9485 | (DMX) | |
| 0255 | VARINA | POCAHONTAS | IA | 4266 | 9490 | LOCATION APPROXIMATE. NEAR VARINA TOWARD THE POCAHONTAS/BUENA VISTA COUNTY LINE. (DMX) | |
| 0317 | 1 W POCAHONTAS | POCAHONTAS | IA | 4274 | 9469 | LARGE WEDGE TORNADO IN PROGRESS. (DMX) |
Hook echoes from DMX base reflectivity.
Hook echoes from DMX base reflectivity--closer view
Storm-relative velocity (N0S) for hook echoes from DMX
VIL (NVL) for hook echoes from DMX
VIL (NVL) for hook echoes from DMX--closer view
Storm Splitting and Cell Motion
Splitting cells and storm movement deviating from the mean flow are an additional indication of severe weather:
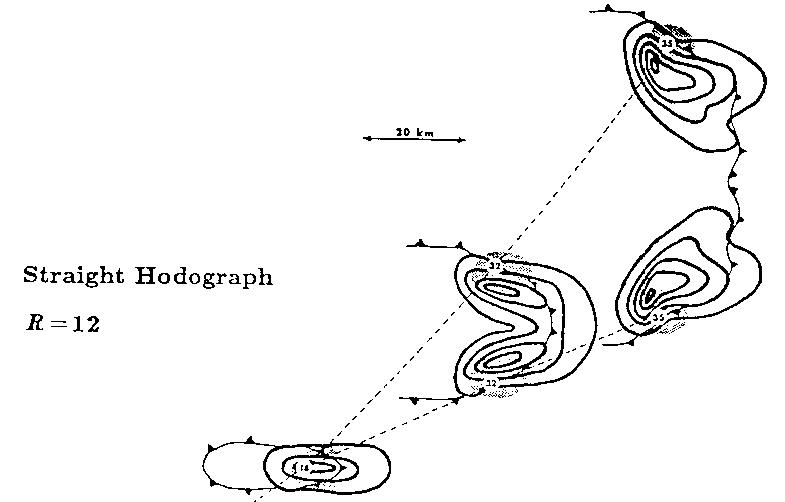
This occurs in environments with strong wind shear, and can result in tornado formation:
Splitting supercell event. This Storm Prediction Center case is from April 7, 2006, same case as the hook echoes shown above. Scroll down in left window and click on "Rad."
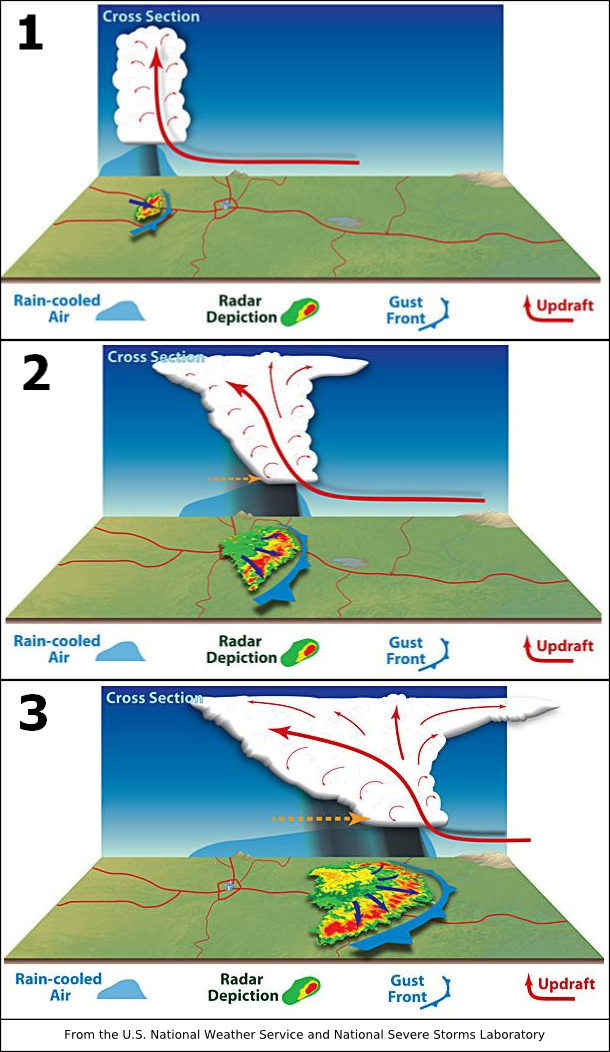
Leading edge gradient: A strong gradient of reflectivity on the edge of an area of strong echoes. It is indicative of a rapid transition between updrafts (weak or no echoes) and downdrafts (intense echoes where precipitation is reaching ground) and is a sign that the storm is severe. There can be much turbulence associated with the close proximity of the up- and downdrafts.
WER and BWER
WER: Weak echo region.
BWER: Bounded weak echo region.
The following slide from NWS Milwaukee summarizes some reflectivity considerations for assessing radar echos for severe weather: